
Financial Architecture for Executives: The Strategic Blueprint for Deconstructing Balance Sheets & Income Reports

Gulf Euro For Training
Content Management Department

Financial statement literacy is the single most critical strategic competency for C-suite executives, board members, and business unit heads. Without a rigorous grasp of accounting architecture, strategic capital allocation becomes an exercise in unmitigated risk.
In this comprehensive executive guide, we deconstruct the core mechanics of the Income Statement and walk through the closed-loop interrelationship architecture linking the Balance Sheet, Income Statement, and Cash Flow Statement for XYZ Corporation using the visual diagrams below.
1. Income Statement Quantitative Breakdown (Income Statement Model)
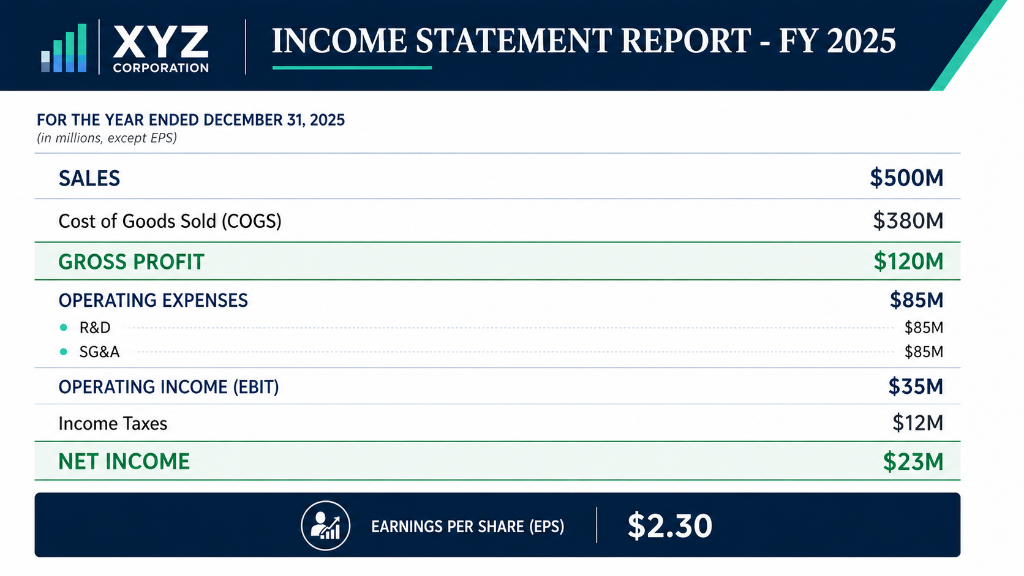
The Income Statement measures the operational profitability of an enterprise over a specific fiscal period. The visual report below highlights the audited performance breakdown for XYZ Corporation for the fiscal year ended December 31, 2025:
Strategic Analysis of Key Income Statement Line Items:
- Sales Revenue ($500M): Represents the total top-line commercial throughput and market adoption rate.
- Cost of Goods Sold ($380M COGS): Encompasses direct production, material, and service delivery expenses. The resulting $120M Gross Profit represents a 24% gross margin.
- Operating Expenses ($85M OpEx): Comprises Research & Development (R&D) and Sales, General & Administrative (SG&A) expenditures aimed at maintaining competitive moats.
- Operating Income / EBIT ($35M): The purest measure of operational efficiency, isolating core business earnings from debt capital structure and taxation.
- Net Income ($23M) & EPS ($2.30): The net residual value available to shareholders, generating $2.30 per common share.
2. Financial Statements Interrelationship Architecture
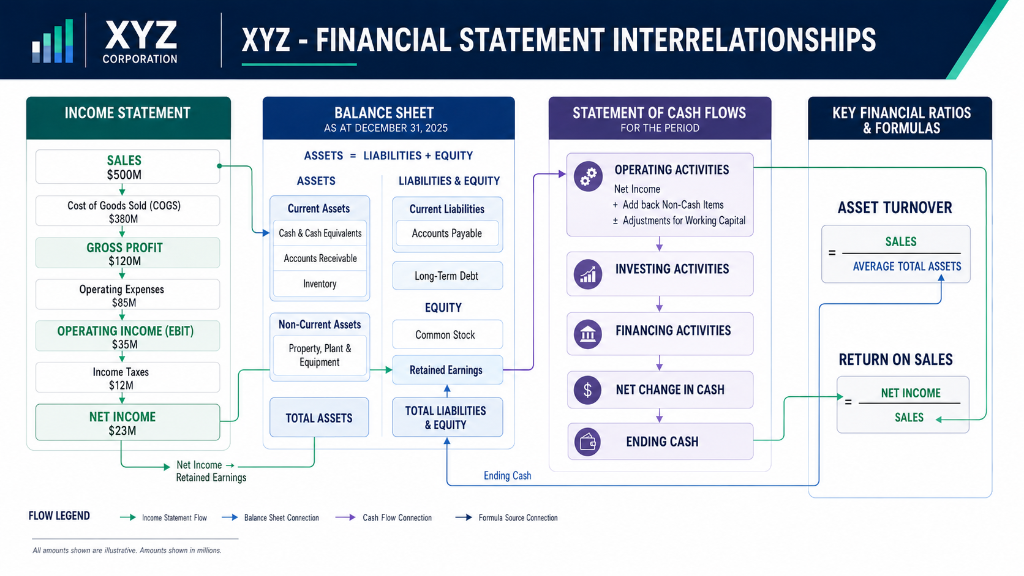
Financial statements do not exist in isolation; they form a tightly coupled financial engine. The interrelationship diagram below illustrates the exact flow of funds across the Balance Sheet, Income Statement, and Cash Flow Statement for XYZ Corporation:
Deconstructing the Three Core Connections:
- Income Statement to Balance Sheet Integration: Net Income ($23M) generated on the Income Statement flows directly into Retained Earnings within Stockholders' Equity on the Balance Sheet (less declared dividend distributions), compounding shareholder equity value.
- Cash Flow Statement to Balance Sheet Integration: The Cash Flow Statement reconciles Net Income with non-cash expenses (Depreciation & Amortization) and Working Capital adjustments (Accounts Receivable, Inventory, Accounts Payable). Operating, Investing, and Financing cash flows accumulate to determine Ending Cash, which matches the Cash & Cash Equivalents figure on the Balance Sheet.
-
Governing Financial Ratio Calculations:
- Asset Turnover Ratio: Calculated as Sales ($500M) divided by Average Total Assets. Evaluates how efficiently executive management deploys capital assets to generate top-line revenue.
- Return on Sales (Profit Margin): Calculated as Net Income ($23M) divided by Sales ($500M), yielding a 4.6% margin. Measures the enterprise's ability to retain cash from top-line sales after all expenses.
3. Critical Financial Red Flags Every Executive Must Monitor
When reviewing board packages, C-suite leaders must watch for key warning signals that indicate underlying financial distress:
- Divergence Between Net Income and Operating Cash Flow: Consistently reporting high Net Income alongside negative or flat Operating Cash Flow signals poor earnings quality and uncollectible receivables.
- Inventory Growth Outpacing Sales Velocity: Indicates product obsolescence, supply chain friction, or imminent inventory write-downs.
- Short-Term Debt Funding Long-Term Assets: Maturity mismatching exposes the enterprise to liquidity squeezes during credit contractions.
4. The Executive Boardroom Review Checklist
Before granting final approval to financial reports or capital budget expansions, ask these seven essential questions:
- 1. Is operating profit growing at a rate consistent with top-line revenue growth?
- 2. What is the enterprise cash conversion rate (Operating Cash Flow ÷ Net Income)?
- 3. Does operating cash flow fully fund planned Capital Expenditures (CapEx)?
- 4. What is the current Debt-to-Equity ratio and how does it impact debt covenants?
- 5. Are there any off-balance-sheet liabilities or undisclosed contingent obligations?
- 6. How sensitive is operating income to a 10% increase in direct material costs?
- 7. Do current cash reserves adequately support planned corporate expansion over the next 12 months?
Advance Your Executive Financial Mastery
To equip your leadership team with advanced skills in financial statement analysis, ratio diagnostic techniques, and strategic corporate valuation, we invite you to explore our certified executive training programs: